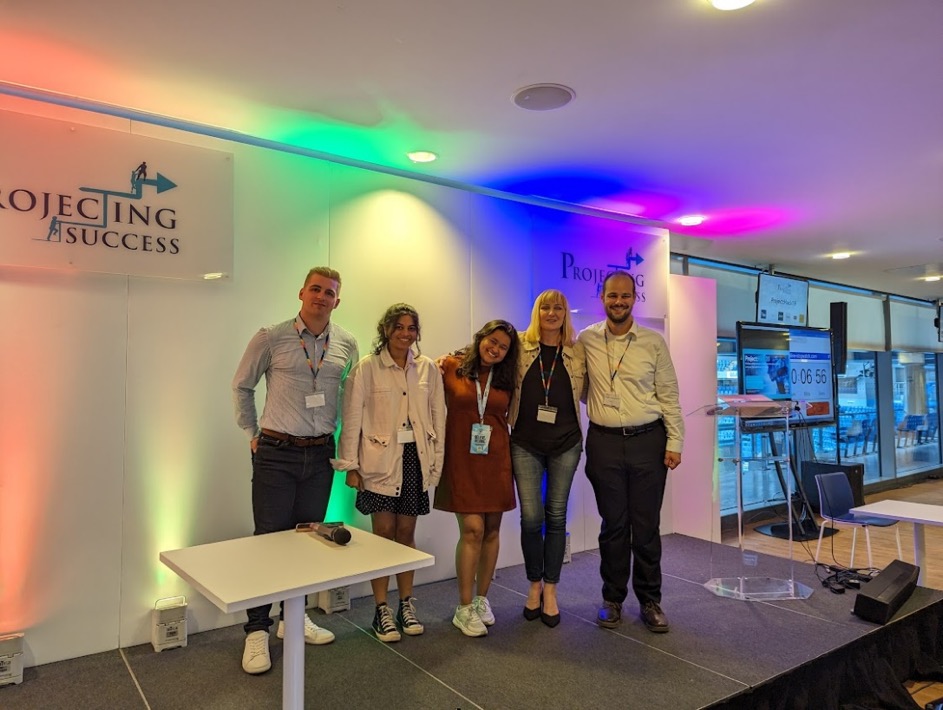
In the vibrant city of Manchester, the Etihad Stadium hosted the much-anticipated Hack19 hackathon. Among a diverse array of intriguing challenges, one task caught our attention: Challenge 9, designed by Gleeds and titled “Visual to Natural Language Converter.” The challenge presented a formidable mission: to harness the potential of machine learning in deciphering meaning and extracting valuable data from complex graphs.
As the event unfolded, an atmosphere of excitement and technical exploration filled the room. This promised to be an engaging journey into the world of data-driven innovation.
The Challenge
Unfortunately for our team, Challenge Nine, “Visual to Natural Language Converter,” quickly proved to be a formidable challenge due to the uncharted territory. The task of using AI to extract data and meaning from graphs presented unique complexities.
A significant challenge arose as much of the meaning in graphs is derived not just from the numerical data but also from the text. Furthermore, design elements like colour, legends, and other visual cues played a crucial role in conveying information. These factors added a layer of complexity. As AI systems had to not only interpret numerical data but also recognise and interpret textual and design elements accurately.
The Plan
For such a significant challenge we decided to split up. The first subgroup embarked on training a specialised model capable of identifying a wide range of graph types. Building upon established academic research, this dedicated team worked to refine the model’s ability to categorise and differentiate graphs accurately. Their efforts were instrumental in laying the foundation for an AI system that could effectively classify and understand the diverse visual representations of data encountered in the challenge.
In parallel, the second subgroup took a groundbreaking approach by delving into the raw data that underpinned Gleeds’ graph creations. Their mission was to streamline the process of translating data into meaningful visuals. Leveraging a ChatGPT API, this team crafted descriptive narratives that provided valuable context to the data.
Simultaneously, they utilised a Python script to autonomously design informative graphs. This innovative methodology aimed to empower Gleeds to seamlessly transform raw data into insightful visualisations. Offering a novel solution that bridged the crucial gap between data and its graphical representation, further elevating the challenge’s complexity.
The Result

Above you can see the outputted graph from the python script. Below you can see the description provided by ChatGPT. You can see how the bot is designed to ask the user for what they would like ChatGPT to describe. This empowers the user to craft their own unique description which meets their own criteria. (For all the code that was used, please find the links below to GitHub for the raw code)

The Hack19 challenge proved to be a fantastic opportunity to showcase our skills. We welcomed the opportunity to push the boundaries of technology and tackle the complexities of AI and data visualisation head-on. Our challenge involved harnessing machine learning for graph classification, ChatGPT API for contextual data descriptions, and Python scripting for graph design.
As we look ahead, these technologies will remain pivotal in our quest for innovative solutions and data-driven insights across various company projects here at Data Stream UK. We eagerly anticipate future challenges and opportunities to contribute to the ever-evolving landscape of data science and technology. A special thanks goes to our dedicated teammates and Projecting Success for organising the event.
Links
Group presentation: https://www.youtube.com/watch?v=sFpI3J7Vk8o&list=PLM0EU9nRaeVCZIWIiRzwgVw-wTojEy-9u&index=23
Raw Code: https://github.com/elliotfearn/github-slideshow/blob/master/Hack19.ipynb
Research Paper: https://arxiv.org/pdf/1906.11906.pdf


